The Engagement tab provides you with important data about mentee and mentor engagement, such as conversations logged, flags reported, and text messages sent.
The Engagement tab helps you track key indicators and dig deeper into data on engagement throughout the course of the program.
Top-Line Numbers
The row of top-line numbers shows the current totals for some of the most crucial engagement numbers such as conversations logged and priority flags.
Each number also shows an indicator beneath it that gives the change since the previous week.
At a quick glance, this data allows you to get a sense of the state of engagement in your program, to help you keep on top of any areas that might benefit from extra attention.
Engagement Topics Over Time Chart
The Engagement topics over time line chart displays the cumulative topics reported for flag metrics, over the course of the program or a custom timeframe.
This chart the following controls:
- Data Point - choose which data point to view: Priority Flag Topics or Non-Immediate Flag Topics
- Timeframe - select the desired timeframe: All Time, Last 30 Days, Last 7 Days
- Metric - select whether to view the data as Numbers or Percent
Note: Participants can select multiple topics for a single flag, if they choose. Therefore, one flag may be represented under multiple lines, or topics, in this chart.
The Engagement topics over time chart is one of the best tools for keeping track of overall trends in your mentees’ struggles over the course of the program.
Engagement Topic Distribution Chart
The Engagement topic distribution pie chart displays the cumulative topics reported for priority flags in a quick, easy-to-digest visualization.
This chart has the following controls:
- Data Point - choose which data point to view: Priority Flag Topics
- Timeframe - select the desired timeframe: All Time, Last 30 Days, Last 7 Days
-
Metric - select whether to view the data as Numbers or Percent
- The distribution will remain the same, but the metric displayed when you hover over a slice of the chart will be adjusted.
- View Specific Mentorships - click on a slice of the chart, and you will be rerouted to the Mentorships page, pre-filtered to mentorships that have reported the topic you selected
Note: Participants can select multiple topics for a single flag if they choose. Therefore, one flag may be represented under multiple lines, or topics, in this chart.
The Engagement topic distribution chart provides the ability to both spot recent or all time trends and drill down into specific mentorships reporting specific topics.
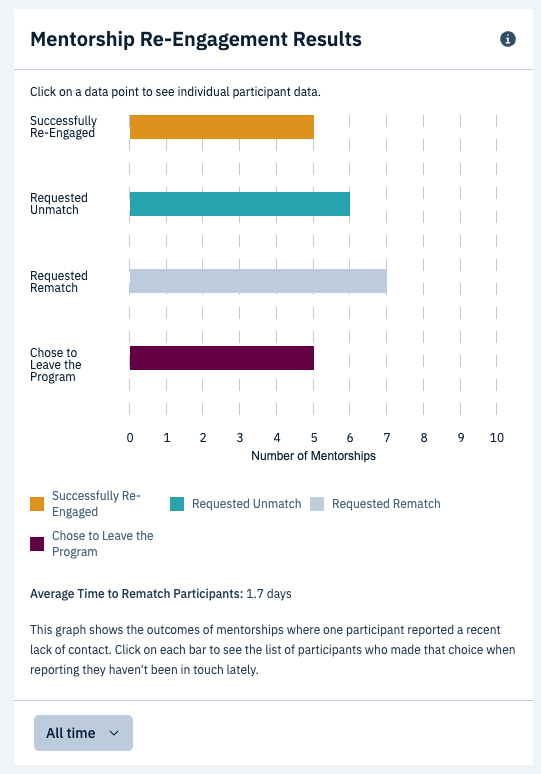
Mentorship Re-Engagement Results
If a participant is having trouble connecting with their counterpart, they can take immediate action in their Participant Dashboard and resolve any concerns with a variety of options. The Mentorship Re-Engagement Results graph displays the outcome of these mentorships where one participant reported a recent lack of contact.
This chart has the following controls:
- Timeframe - select the desired timeframe: All Time, Last 30 Days, Last 7 Days
- View Specific Participants - click on a bar, and you will be rerouted to the Participants page, pre-filtered to participants who took that particular action
This graph provides insight into the results of ongoing (re)engagement efforts, ensuring that participants can get and stay in touch with their counterparts and remain satisfied with their mentorship experience.
How Can I Use These Insights?
Flag Trends
The Engagement Topic Over Time and Distribution Charts allow you to gain insight into aggregate trends that allow you to go beyond individual intervention alone :by TopicWith these graphs, you can easily see what flags are reported most often, and when certain flags peak. Use this information to inform support the broader population and target resources at the right time, to the right people.
- Offer targeted support. You can easily see what flags are reported most often, and when certain flags peak. Use these insights to inform support the broader population and target resources at the right time, to the right people.
- Connect campus stakeholders with peer-provided data. This data is valuable, not only to you, but to your colleagues across departments. They can use these trends to understand participants' experience with issues related to their department and make adjustments to their strategy as needed.
Re-Engagement Data
The Mentorship Re-Engagement Results graph and fine-grained filter tool allow you to gain insight and take action in ways beyond the raw data:
- Provide additional support. These participants may have had a less-than-ideal start to their mentorship experience. For those who continue in the program, you may want to reach out to thank them for patience and provide encouragement in their next mentorship. For those who leave the program, you may wish to provide alternative campus resources that can provide support.
- Monitor rematch requests. By monitoring the average time to rematch, you can ensure any participants who may have been dissatisfied with their previous mentorship are promptly paired with a new counterpart. Alternatively, this can also flag any potential issues in quick rematches, such as not having enough mentors.
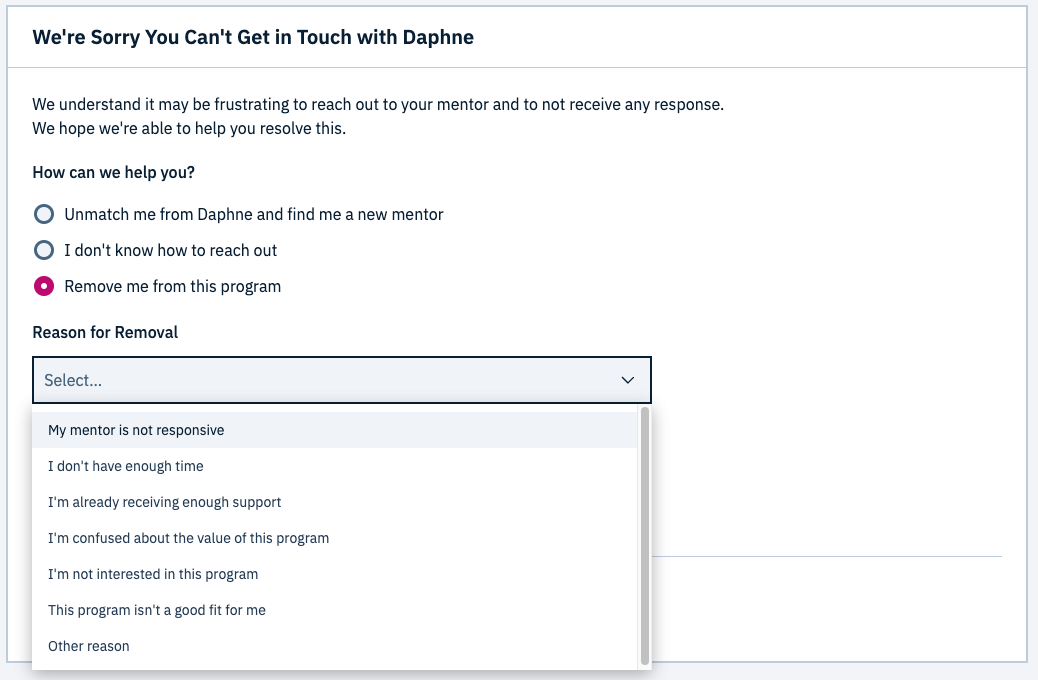
- Understand why participants leave the program. Participants can choose to leave the program as they report a concern with their mentorship and if they do, we ask for the reason why (see below). By clicking on the bar for “Chose to Leave the Program,” you can see the list of all participants who have selected this option and export the list to find further insight into the reason behind their decision.
FAQ
❓How is the “Conversations Logged” number calculated on the “Engagement” tab?
- The “Conversations Logged” number is showing you a total count of the conversations that have been logged for all mentorships in your program, including those that have been unmatched.
❓How is the “Replies to MC Text Messages” number calculated on the “Engagement” tab?
- The “Replies to MC Text Messages” number is showing you a total count of all the responses received when Mentor Collective’s system sends out programmed text messages. The count includes the total response from both registered and invited participants who have not registered.
❓This math doesn’t seem right in the Engagement Topic Over Time or Distribution charts. How can there be more topics than conversations or flags reported?
- Great question! Participants can select multiple topics for a single conversation or flag.
- These two graphs provide the total number of topics reported, not the total conversations or flags reported. Therefore, one conversation or flag may be represented under multiple topics.
❓The number of mentorships in the Mentorship Re-Engagement Results graph doesn’t align with the number of participants I see after clicking on the bar. What’s happening?
- The Mentorship Re-Engagement Results graph displays each mentorship that has resulted in one of the listed re-engagement outcomes. Alternatively, when you click on a bar in the graph, it will bring you to a pre-filtered list of participants who took that particular action on the Participants Page.
- There may be a discrepancy between these two numbers due to participants who have multiple mentorships. Participants with multiple mentorships may be represented in the graph multiple times, but will only be included once in the participant list.
- Example: A mentor has 5 mentees (i.e. mentorships), and requested an unmatch with 2 of them. The “Requested Unmatch” bar might have 81 mentorships represented, but the filtered list may only have 80 participants.
Comments
Please sign in to leave a comment.